Practical fault detection on timeseries part 2: first macros and templates
In the previous fault detection article, we saw how we can cover a lot of ground in fault detection with simple methods and technology that is available today.
It had an example of a simple but effective approach to find sudden spikes (peaks and drops) within fluctuating time series.
This post explains the continuation of that work and provides you the means to implement this yourself with minimal effort.
I'm sharing with you:
[*] Note that some regular patterns can look like this as well. For example weekend traffic lower than weekdays, etc. We see this a lot.
The illustrations don't portray this for simplicity. But the alerting logic below supports this just fine by comparing to same day last week instead of yesterday, etc.

(image redacted to hide confidential information
the numbers are not accurate and for demonstration purposes only)
Note the various links to GE (Graph-Explorer) and Grafana for timeshifts. The Graph-Explorer links are just standard GEQL queries, I usually use this if i want to be easily manage what I'm viewing (compare against other countries, adjust time interval, etc) because that's what GE is really good at. The timeshift view is a Grafana dashboard that takes in a Graphite expression as a template variable, and can hence be set via a GET parameter by using the url
This allows us to easily spot when traffic becomes too low, overly erratic, etc as this example shows:
Gist with bosun macro, template, example use, and Grafana dashboard definition. Load the bosun stuff in your bosun.conf and import the dashboard in Grafana.
The pieces fit together like so:
As I explained in the previous article I fondly believe that the commonly cited solutions (anomaly detection via machine learning) are a very difficult endeavor and results can be achieved much quicker and simpler.
While this only focuses on one class of timeseries (it won't work on diskspace metrics for example) I found this class to be in the most dire need of better fault detection. Hopefully this is useful to you. Good luck and let me know how it goes!
- Bosun macros which detect our most common not-trivially-detectable symptoms of problems
- Bosun notification template which provides a decent amount of information
- Grafana and Graph-Explorer dashboards and integration for further troubleshooting
Target use case
As in the previous article, we focus on the specific category of timeseries metrics driven by user activity. Those series are expected to fluctuate in at least some kind of (usually daily) pattern, but is expected to have a certain smoothness to it. Think web requests per second or uploads per minute. There are a few characteristics that are considered faulty or at least worth our attention: |
 |
 |
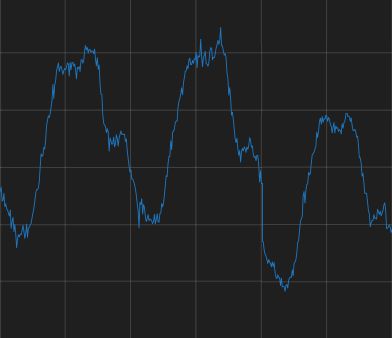 |
| looks good consistent pattern consistent smoothness |
sudden deviation (spike) Almost always something broke or choked. could also be pointing up. ~ peaks and valleys |
increased erraticness Sometimes natural often result of performance issues |
lower values than usual (in the third cycle) Often caused by changes in code or config, sometimes innocent. But best to alert operator in any case [*] |
[*] Note that some regular patterns can look like this as well. For example weekend traffic lower than weekdays, etc. We see this a lot.
The illustrations don't portray this for simplicity. But the alerting logic below supports this just fine by comparing to same day last week instead of yesterday, etc.
Introducing the new approach
The previous article demonstrated using graphite to compute standard deviation. This let us alert on the erraticness of the series in general and as a particularly interesting side-effect, on spikes up and down. The new approach is more refined and concrete by leveraging some of bosun's and Grafana's strengths. We can't always detect the last case above via erraticness checking (a lower amount may be introduced gradually, not via a sudden drop) so now we monitor for that as well, covering all cases above. We use- Bosun macros which encapsulate all the querying and processing
- Bosun template for notifications
- A generic Grafana dashboard which aids in troubleshooting
The best way to introduce this is probably by showing how a notification looks like:
(image redacted to hide confidential information
the numbers are not accurate and for demonstration purposes only)
As you can tell by the sections, we look at some global data (for example "all web traffic", "all log messages", etc), and also
by data segregated by a particular dimension (for example web traffic by country, log messages by key, etc)
To cover all problematic cases outlined above, we do 3 different checks:
(note, everything is parametrized so you can tune it, see further down)
- Global volume: comparing the median value of the last 60 minutes or so against the corresponding 60 minutes last week and expressing it as a "strength ratio". Anything below a given threshold such as 0.8 is alerted on
- Global erraticness. To find all forms of erraticness (increased deviation), we use a refined formula. See details below. A graph of the input data is included so you can visually verify the series
- On the segregated data: compare current (hour or so) median against median derived from the corresponding hours during the past few weeks, and only allow a certain amount of standard deviations difference
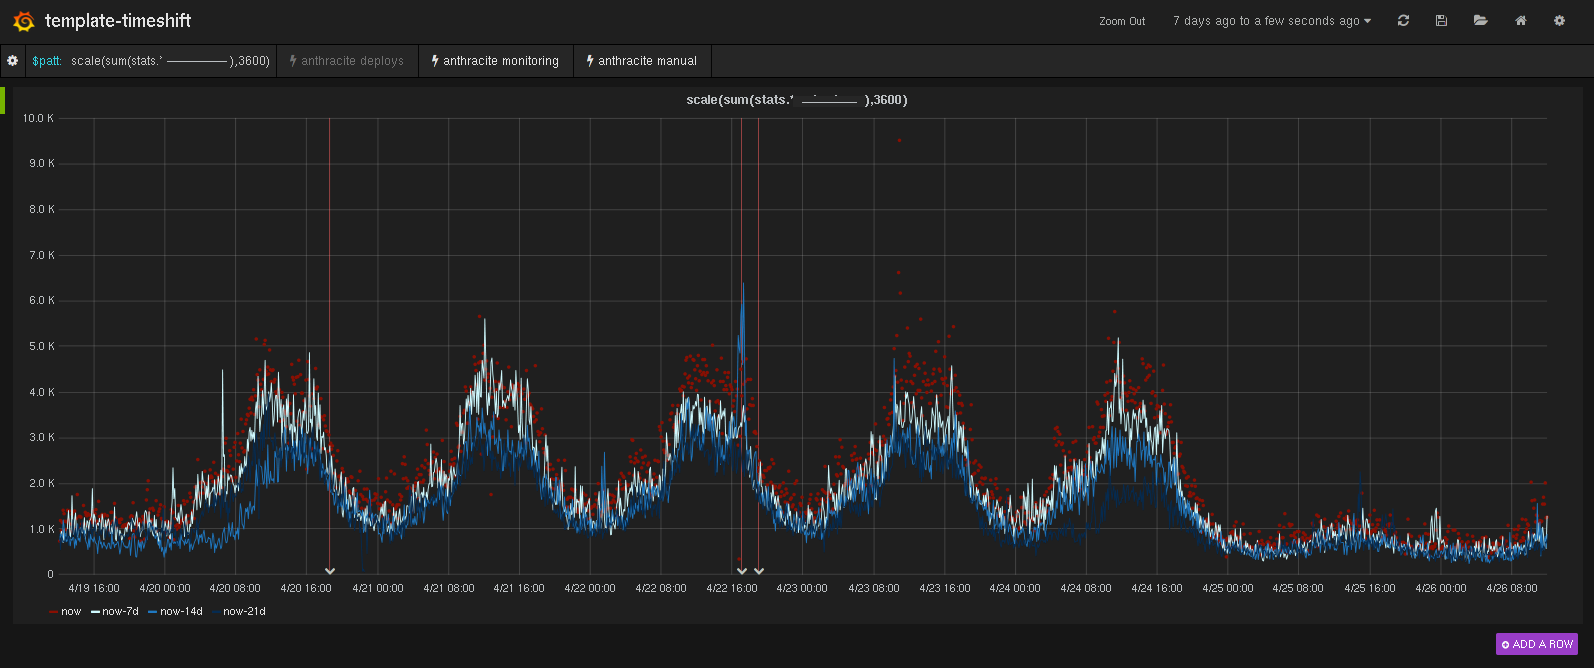
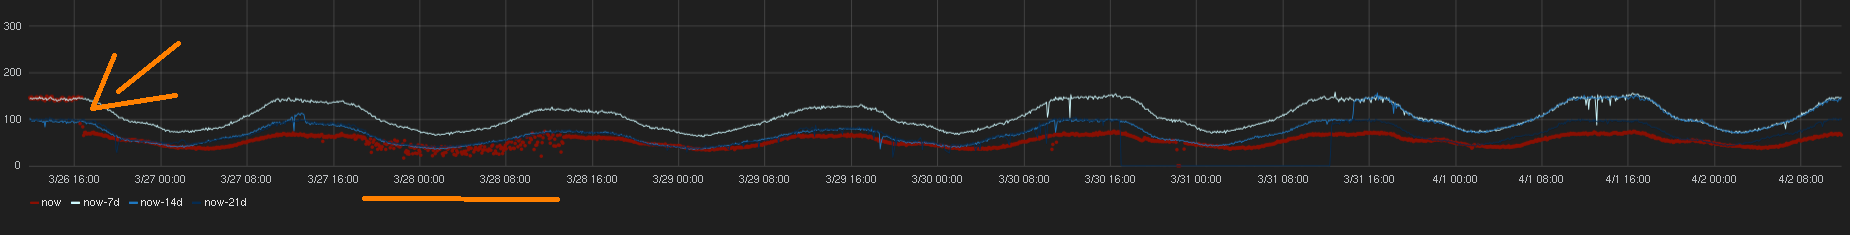
Note the various links to GE (Graph-Explorer) and Grafana for timeshifts. The Graph-Explorer links are just standard GEQL queries, I usually use this if i want to be easily manage what I'm viewing (compare against other countries, adjust time interval, etc) because that's what GE is really good at. The timeshift view is a Grafana dashboard that takes in a Graphite expression as a template variable, and can hence be set via a GET parameter by using the url
http://grafana/#/dashboard/db/templatetimeshift?var-patt=expressionIt shows the current past week as red dots, and the past weeks before that as timeshifts in various shades of blue representing the age of the data. (darker is older).
This allows us to easily spot when traffic becomes too low, overly erratic, etc as this example shows:
Getting started
Note: I Won't explain the details of the bosun configuration. Familiarity with bosun is assumed. The bosun documentation is pretty complete.Gist with bosun macro, template, example use, and Grafana dashboard definition. Load the bosun stuff in your bosun.conf and import the dashboard in Grafana.
The pieces fit together like so:
- The alert is where we define the graphite queries, the name of the dimension segregated by (used in template), how long the periods are, what the various thresholds are and the expressions to be fed into Grafana and Graph-Explorer.
It also lets you set an importance which controls the sorting of the segregated entries in the notification (see screenshot). By default it is based on the historical median of the values but you could override this. For example for a particular alert we maintain a lookup table with custom importance values. - The macros are split in two:
- dm-load loads all the initial data based on your queries and computes a bunch of the numbers.
- dm-logic does some final computations and evaluates the warning and critical state expressions.
We warn if one or more segregated items didn't meet their median requirements, and if erraticness exceeds its threshold (note that the latter can be disabled).
Critical is when more than the specified number of segregated items didn't meet their median requirements, the global volume didn't meet the strength ratio, or if erraticness is enabled and above the critical threshold. - The template is evaluated and generates the notification like shown above
- Links to Grafana (timeshift) and GE are generated in the notification to make it easy to start troubleshooting
Erraticness formula refinements
You may notice that the formula has changed to(deviation-now * median-historical) / ((deviation-historical * median-now) + 0.01)
- Current deviation is compared to an automatically chosen historical deviation value (so no more need to manually set this)
- Accounts for difference in volume: for example if traffic at any point is much higher, we can also expect the deviation to be higher. With the previous formula we would have cases where in the past the numbers were very low, and naturally the deviation then was low and not a reasonable standard to be held against when traffic is higher, resulting in trigger happy alerting with false positives.
Now we give a fair weight to the deviation ratio by making it inversely proportional to the median ratio - The + 0.01 is to avoid division by zero
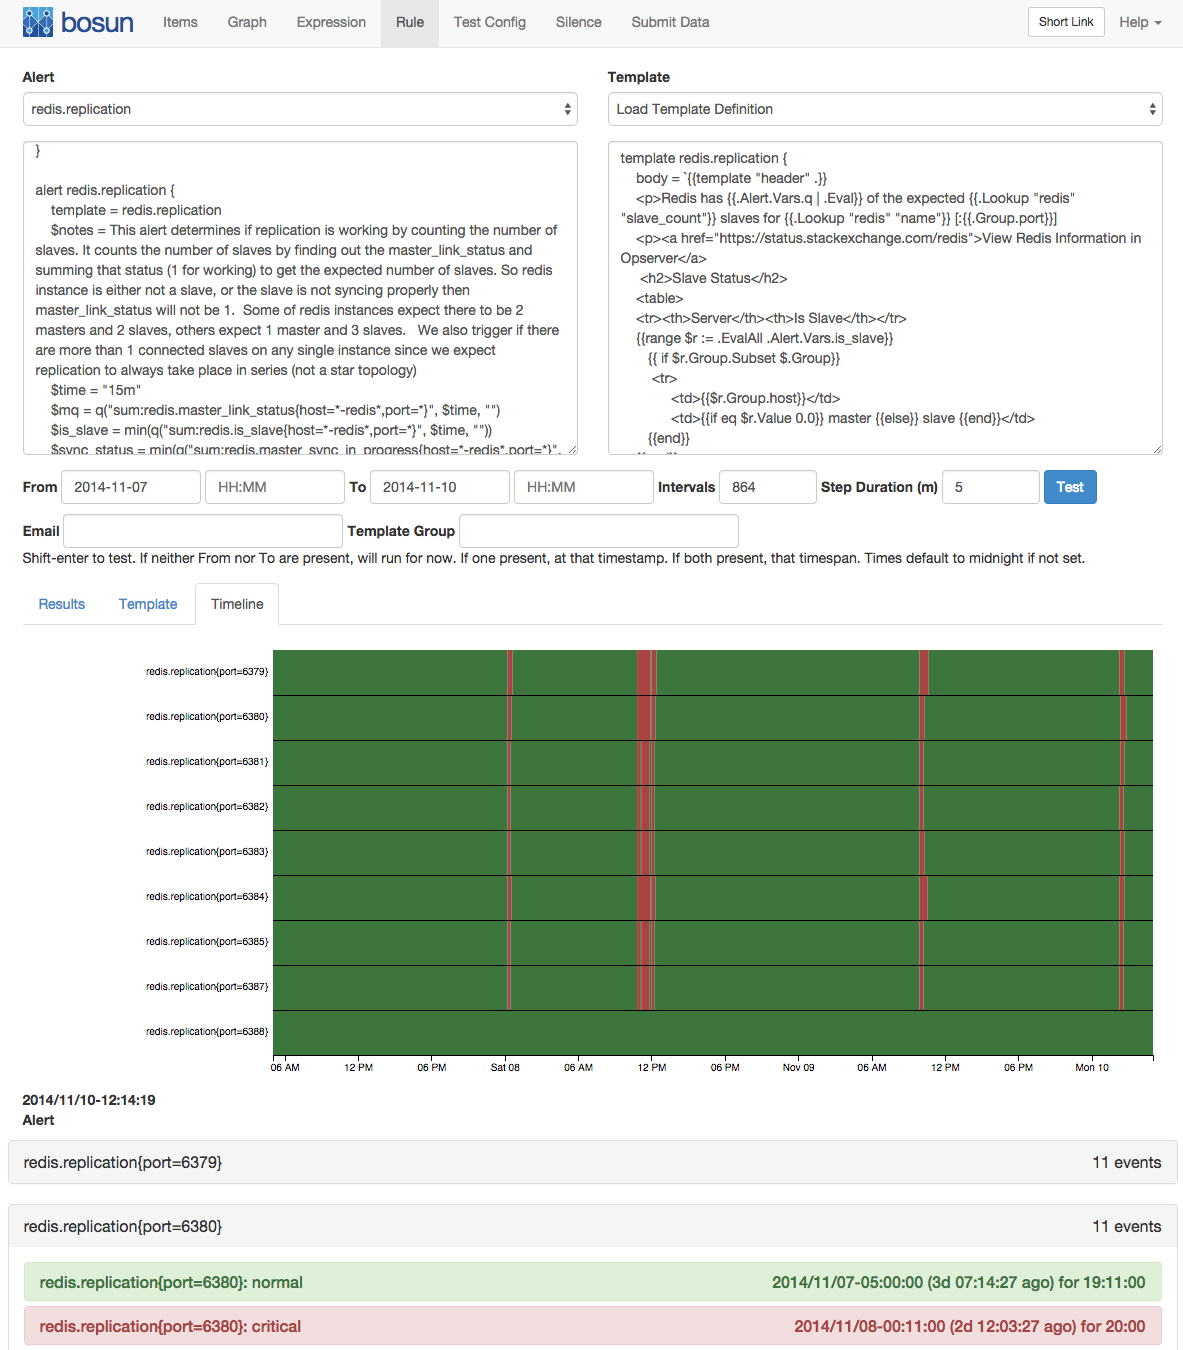
Still far from perfect
While this has been very helpful to us, I want to highlight a few things that could be improved.- With these alerts, you'll find yourself wanting to iteratively fine tune the various parameters and validate the result of your changes by comparing the status-over-time timeline before and after the change. While Bosun already makes iterative development easier and lets you run test rules against old data and look at a the status over time, the interface could be improved by
- showing timeseries (with event markers where relevant) alongside the status visualization, so you have context to interpret the status timeline
- routinely building a knowledge base of time ranges annotated with a given state for a given alerting concern, which would help in validating the generated status timeline, both visually and in code. We could compute percentage of issues found, missed, etc. "unit tests for alerting" my boss called it.
- Template could be prettier. In particular the plots often don't render very well. We're looking into closer Grafana-Bosun integration so I think that will be resolved at some point.
- Current logic doesn't take past outages into account. "just taking enough periods in graphiteBand()" helps alleviate it mostly, but it's not very robust
- See that drop in the screenshot a bit higher up? That one was preceded by a code deploy event in anthracite which made some changes where a drop in traffic was actually expected. Would love to be able to mark stuff like this in deploys (like putting in the commit message something like "expect 20-50 drop" and have the monitoring system leverage that.
In conclusion
I know many people are struggling with poor alerting rules (static thresholds?)As I explained in the previous article I fondly believe that the commonly cited solutions (anomaly detection via machine learning) are a very difficult endeavor and results can be achieved much quicker and simpler.
While this only focuses on one class of timeseries (it won't work on diskspace metrics for example) I found this class to be in the most dire need of better fault detection. Hopefully this is useful to you. Good luck and let me know how it goes!
Add comment

@name