A few common graphite problems and how they are already solved.
metrics often seem to lack details, such as units and metric types
looking at a metric name, it's often hard to know- the unit a metric is measured in (bits, queries per second, jiffies, etc)
- the "type" (a rate, an ever increasing counter, gauge, etc)
- the scale/prefix (absolute, relative, percentage, mega, milli, etc)
what
what is being measured?: bytes, queries, timeouts, jobs, etctarget_type
must be one of the existing clearly defined target_types (count, rate, counter, gauge)
These match statsd metric types (i.e. rate is per second, count is per flushInterval)
This will also allow you to request graphs in a different unit and the dashboard will know how to convert (say, Mbps to GB/day)
tree navigation/querying is cumbersome, metrics search is broken. How do I organize the tree anyway?
the tree is a simplistic model. There is simply too much dimensionality that can't be expressed in a flat tree. There's no way you can organize it so that will it satisfy all later needs. A tag space like structured_metrics makes it obsolete. with Graph-Explorer you can do (full-text) search on metric name, by any of their tags, and/or by added metadata. So practically you can filter by things like server, service, unit (e.g. anything expressed in bits/bytes per second, or anything denoting errors). All this irrespective of the source of a metric or the "location in the tree".no interactivity with graphs
timeserieswidget allows you to easily add interactive graphite graph objects to html pages. You get modern features like togglable/reorderable metrics, realtime switching between lines/stacked, information popups on hoover, highlighting, smoothing, and (WIP) realtime zooming. It has a canvas (flot) and svg (rickshaw/d3) backend. So it basically provides a simpler api to use these libraries specifically with graphite.There's a bunch of different graphite dashboards with different takes on graph composition/configuration and workflow, but the actual rendering of graphs usually comes down to plotting some graphite targets with a legend. timeserieswidget aims to be a drop-in plugin that brings all modern features so that different dashboards can benefit from a common, shared codebase, because static PNGs are a thing from the past
screenshot:
")
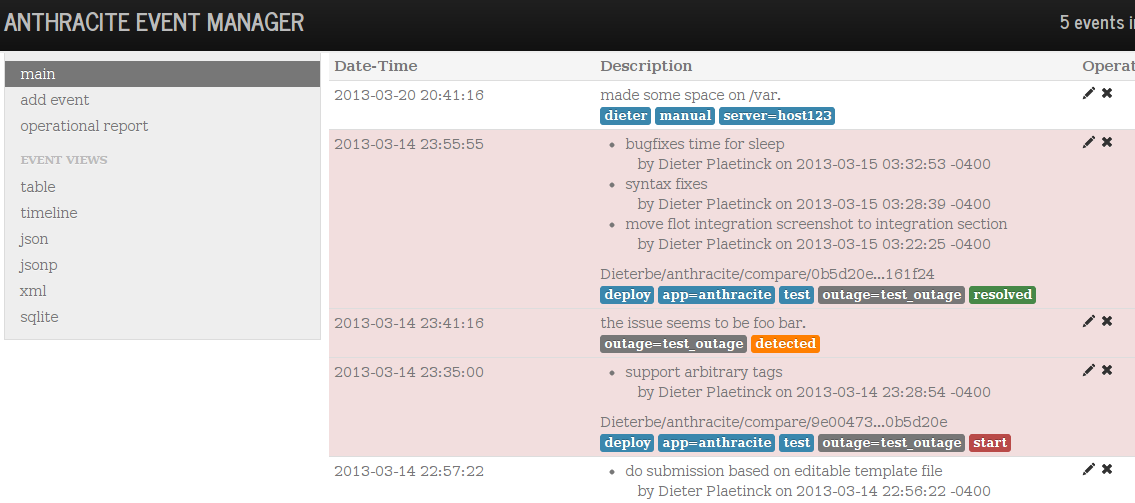
events lack text annotations, they are simplistic and badly supported
Graphite is a great system for time series metrics. Not for events. metrics and events are very different things across the board. drawAsInFinite() is a bit of a hack.- anthracite is designed specifically to manage events.
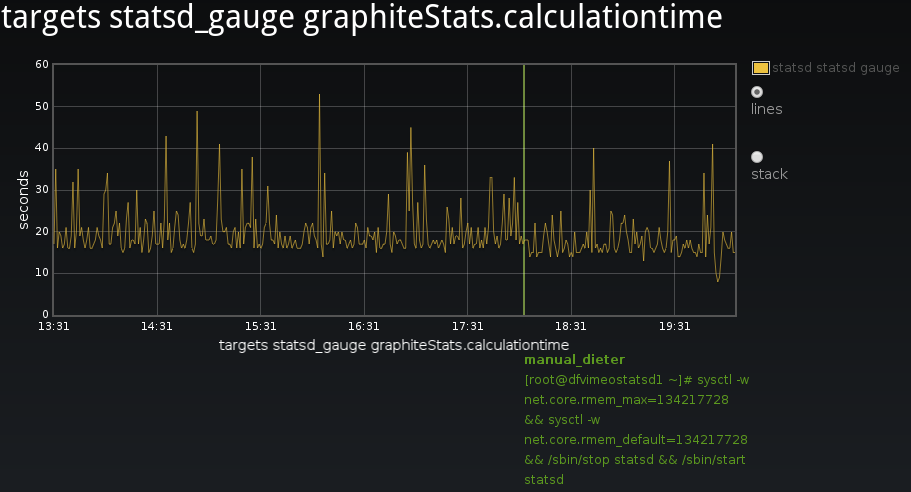
It brings extra features such as different submission scripts, outage annotations, various ways to see events and reports with uptime/MTTR/etc metrics. - timeserieswidget displays your events on graphs along with their metadata (which can be just some text or even html code).
this is where client side rendering shines
screenshots:
cumbersome to compose graphs
There's basically two approaches:- interactive composing: with the graphite composer, you navigate through the tree and apply functions. This is painfull, dashboards like descartes and graphiti can make this easier
- use a dashboard that uses predefined templates (gdash and others) They often impose a strict navigation path to reach pages which may or may not give you the information you need (usually less or way more)
This becomes unwieldy but is useful for various use cases and needs.
However, neither approach is convenient for changing information needs.
Especially when troubleshooting, one day you might want to compare the rate of increase of open file handles on a set of specific servers to the traffic on given network switches, the next day it's something completely different.
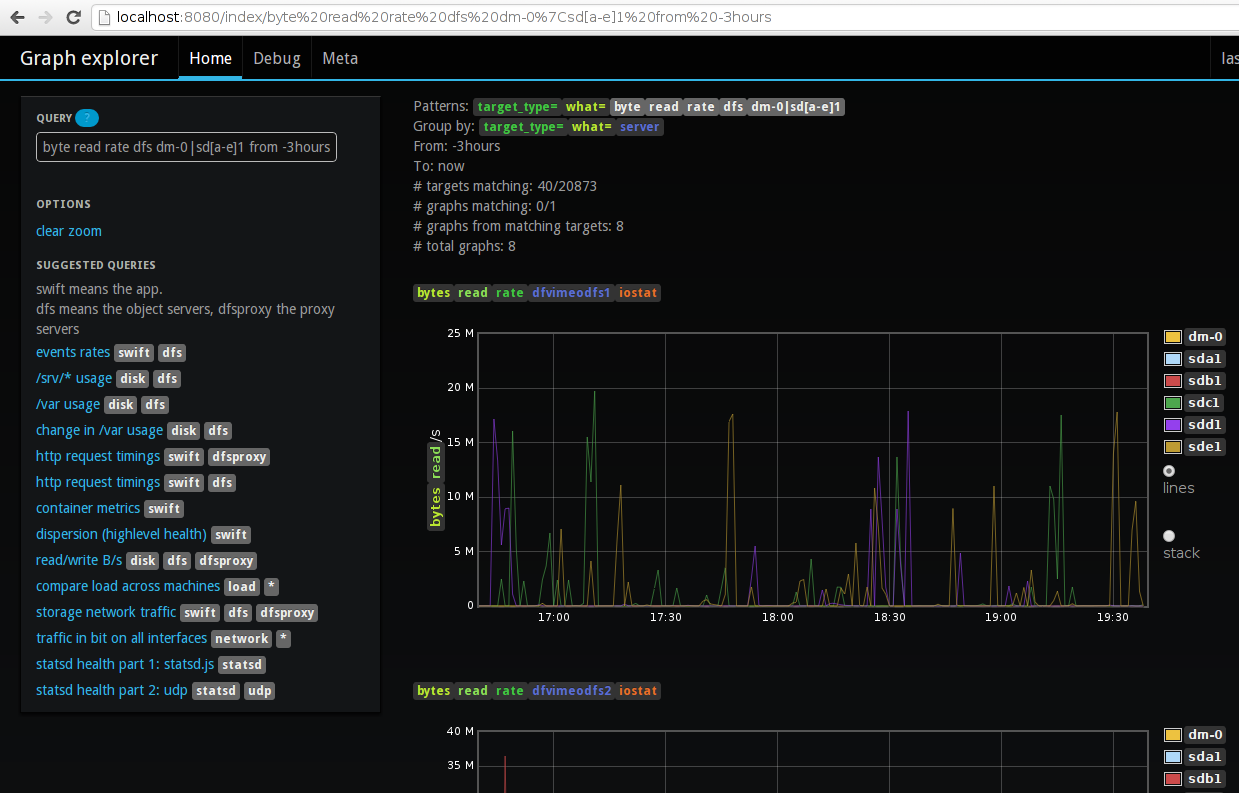
With Graph-Explorer:
- GE gives you a query interface on top of structured_metric's tag space. this enables a bunch of things (see above)
- you can yield arbitrary targets for each metric, to look at the same thing from a different angle (i.e. as a rate with `derivative()` or as a daily summary), and you can of course filter by angle
- You can group metrics into graphs by arbitrary tags (e.g. you can see bytes used of all filesystems on a graph per server, or compare servers on a graph per filesystem). This feature always results in the "wow that's really cool" every time I show it
- GE includes 'what' and 'target_type' in the group_by tags by default so basically, if things are in a different unit (B/s vs B vs b etc) it'll put them in separate graphs (controllable in query)
- GE automatically generates the graph title and vertical title (always showing the 'what' and the unit), and shows all metrics' extra tags. This also gives you a lot of inspiration to modify or extend your query
limited options to request a specific time range
GE's query language supports freeform `from` and `to` clauses.Referenced projects
-
anthracite:
event/change logging/management with a bunch of ingestion scripts and outage reports -
timeserieswidget:
jquery plugin to easily get highly interactive graphite graphs onto html pages (dashboards) -
structured_metrics:
python library to convert graphite metrics tree into a tag space with clearly defined units and target types, and arbitrary metadata. -
graph-explorer:
dashboard that provides a query language so you can easily compose graphs on the fly to satisfy varying information needs.
Future work
There's a whole lot going on in the monitoring space, but I'd like to highlight a few things I personally want to work more on:-
I spoke with Michael Leinartas at Monitorama (and there's also a launchpad thread).
We agreed that native tags in graphite are the way forward. This will address some of the pain points
I'm already fixing with structured_metrics but in a more native way.
I envision submitting metrics would move from:
stats.serverdb123.mysql.queries.selects 895 1234567890
to something more along these lines:host=serverdb123 service=mysql type=select what=queries target_type=rate 895 1234567890 host=serverdb123 service=mysql type=select unit=Queries/s 895 1234567890 h=serverdb123 s=mysql t=select queries r 895 1234567890
- switch Anthracite backend to ElasticSearch for native integration with logstash data (and allow you to use kibana)
Add comment

@name